Groundbreaking Data from the Australian Bureau of Statistics
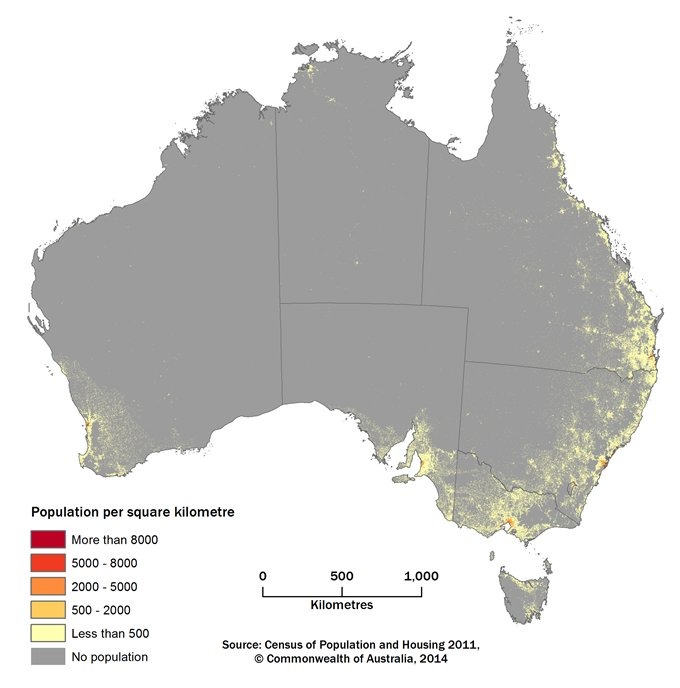
A new release from the Australian Bureau of Statistics (ABS) has provided unprecedented insights into population density across Australia. For the first time, data from the 2011 Census of Population and Housing has been presented in a 1km² grid format, offering a detailed and consistent measurement of population distribution across urban and rural regions. This high-resolution population grid provides valuable insights for urban planning, infrastructure development, and policy-making.
Where Do Australians Live? The 1km² Grid Tells the Story

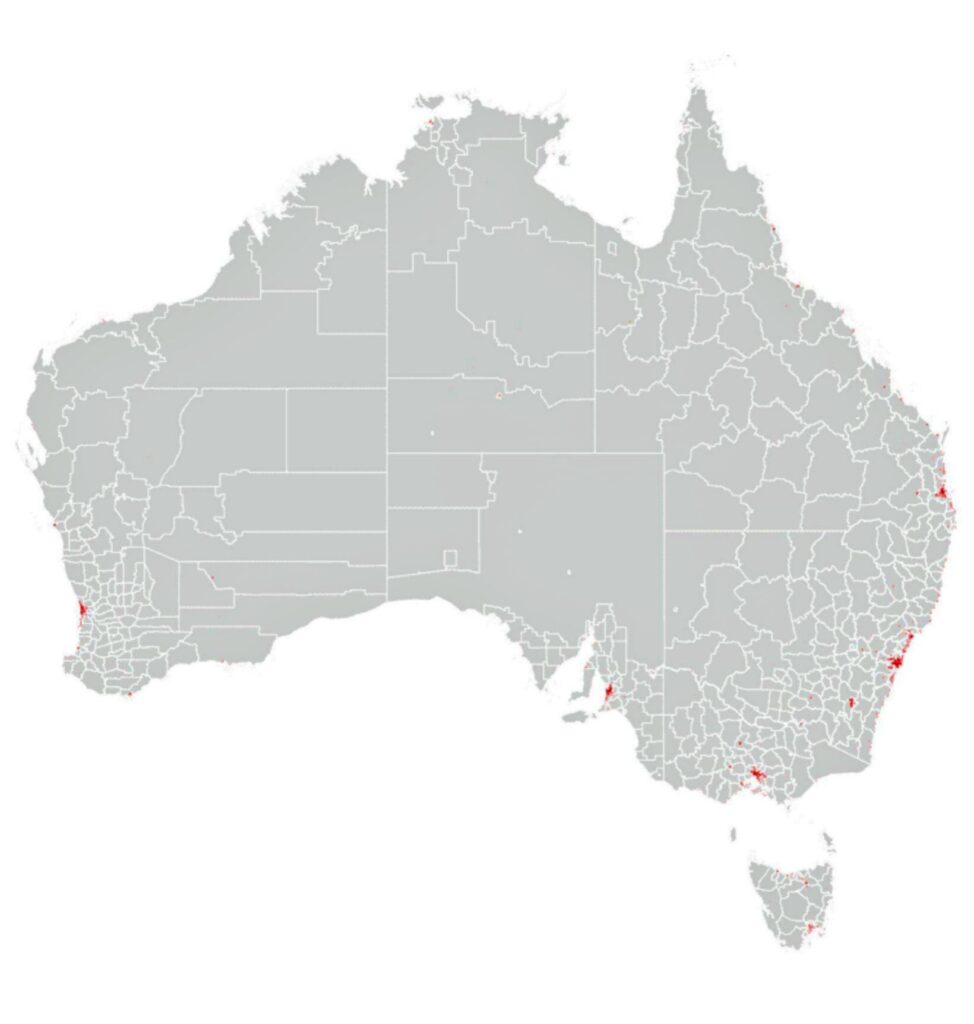
The population density map, built using the Usual Resident Population (URP) model, indicates that more than half of all Australians live in high-density zones, particularly in major cities like Sydney, Melbourne, and Brisbane. This visualization offers a clear contrast between urban centers and sparsely populated rural areas, showing where the highest concentrations of people reside.
Sydney vs. Melbourne: Which City is More Crowded?
The most densely populated area in Australia in 2011 was located in Sydney’s Potts Point and Woolloomooloo suburbs, where 14,747 people lived within a single 1km² grid cell. This makes Sydney the busiest metropolitan area in the country.
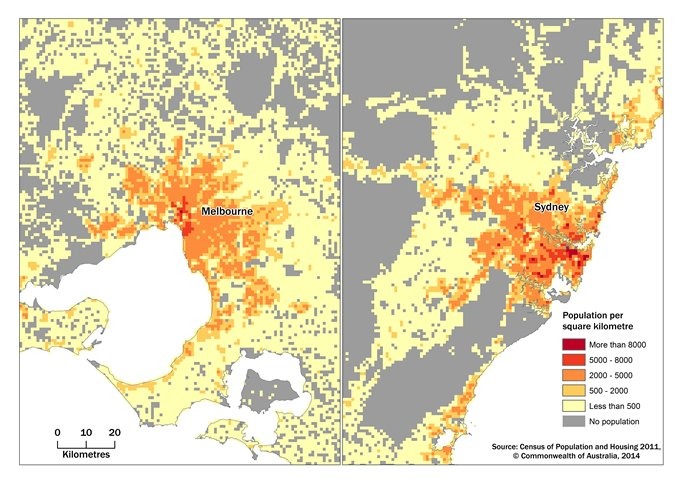
A closer look at high-density zones in Sydney and Melbourne reveals:

- Sydney had 21km² with more than 8,000 people per square kilometer, compared to just 1km² in Melbourne (around Carlton).
- Sydney also had 93km² of moderately high-density zones (5,000–8,000 people per km²), while Melbourne had only 33km² in this range.
- Brisbane was the only other capital city with significant high-density areas, but it had just 3km² in the 5,000–8,000 category.
Australia’s Least and Most Crowded Cities
A city-by-city breakdown shows stark contrasts in population distribution. Brisbane had the largest low-density areas, with 9,275km² of land containing fewer than 500 people per square kilometer. On the other hand, Sydney and Melbourne led the way in high-density living.
Maximum Population Density by Capital City (2011 Census Data)
| City | Max Density (people/km²) |
|---|---|
| Sydney | 10,000+ |
| Melbourne | 10,000+ |
| Brisbane | 6,216 |
| Perth | ~3,000 |
| Adelaide | ~3,000 |
| Canberra | ~3,000 |
| Hobart | ~3,000 |
| Darwin | 2,620 |
Comparing Australia and Europe: How Dense Are Our Cities?

The 1km² grid resolution used by the ABS is comparable to Eurostat’s European population grid, allowing direct comparisons between Australian and European cities. The data reveals that London had a population density of 20,477 people per km² in 2011, significantly higher than Sydney’s most crowded area.
Why Is This Data Important?
The 1km² population grid provides valuable insights for:
- Urban Planning – Understanding population clusters helps governments and city planners optimize housing, public transport, and infrastructure development.
- Real Estate Investment – High-density areas indicate high-demand locations for property development and commercial investment.
- Traffic and Transport Planning – Knowing where people live and commute can help improve road networks, public transit, and congestion management.
- Environmental and Sustainability Policies – Areas with rapid urbanization need better resource management strategies to ensure sustainability.

Final Thoughts
This newly released 1km² population density grid provides an unparalleled view of how Australians are distributed across the country. With more than half of the population living in high-density areas, cities like Sydney and Melbourne continue to dominate in population growth. Understanding these patterns is essential for better urban planning, investment opportunities, and policy development in the future.

Leave a Reply