The vast expanse of the oceans has been the stage for countless historical dramas. From the Age of Exploration to the era of colonial empires, maritime powers have shaped the course of human history. Now, thanks to a remarkable data visualization project, we can witness the intricate network of seafaring activities that defined the 18th and 19th centuries.
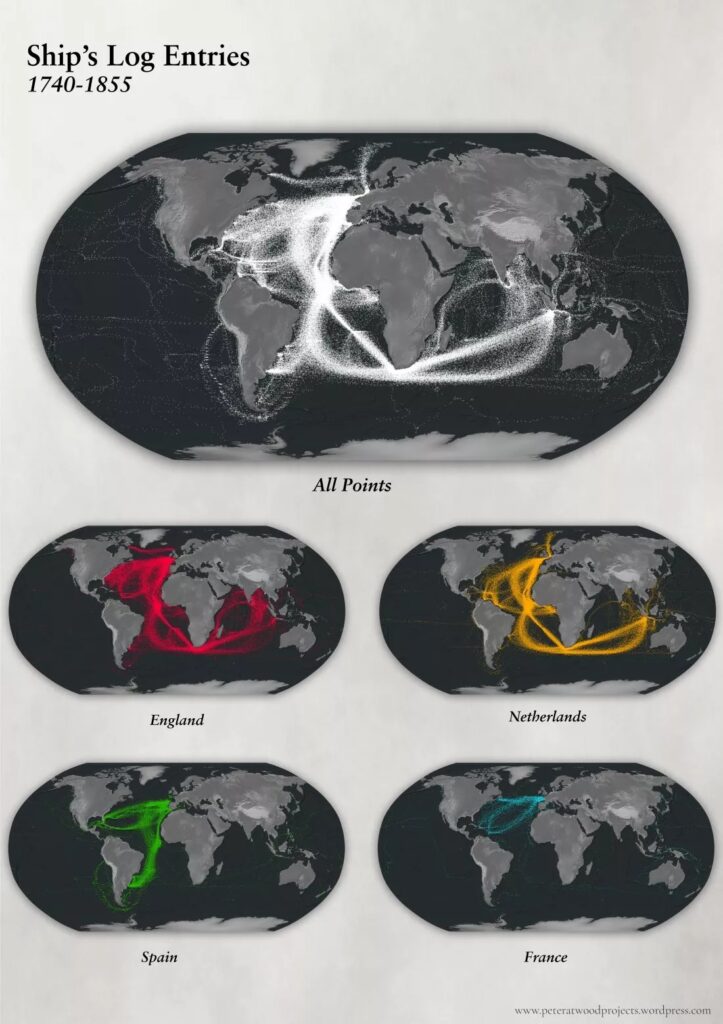
A treasure trove of over 280,000 ship log entries, spanning the years 1740 to 1855, has been meticulously analyzed and mapped by scifiguy95. This extraordinary visualization offers a glimpse into the maritime ambitions of four dominant naval powers: England, the Netherlands, Spain, and France.

A Tapestry of Trade and Exploration
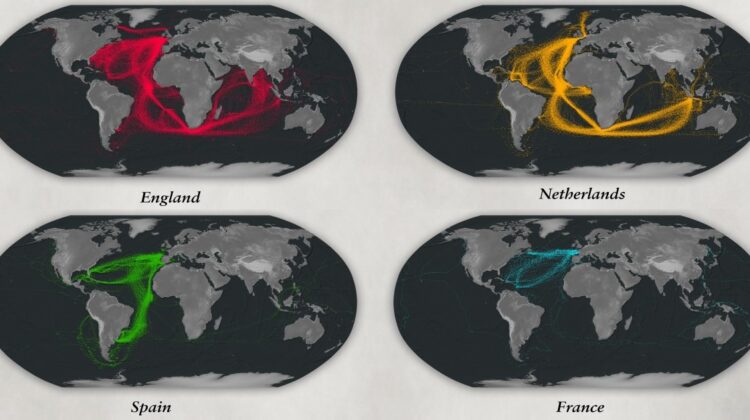
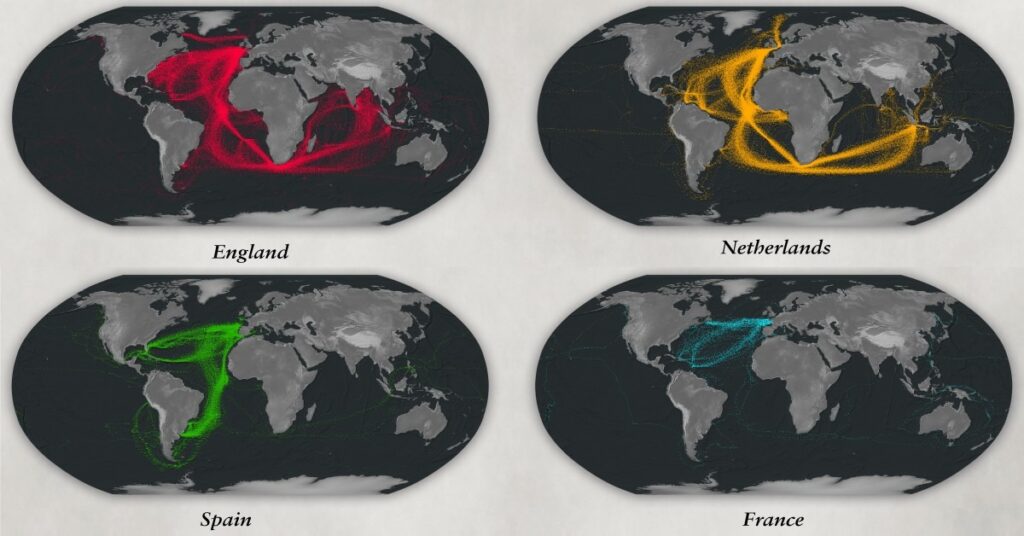
The aggregated map reveals a breathtaking tapestry of trade routes that crisscrossed the globe. The dominance of the British Empire is evident in the dense network of connections between the British Isles and its far-flung colonies. The Dutch, known for their maritime prowess, also had a significant presence in the Atlantic and Indian Oceans. Spain’s focus on its American colonies is clear, while France’s maritime activities were more concentrated in the Caribbean and North America.
Unraveling the Secrets of the Past
By examining these individual maps, we can gain valuable insights into the strategic and economic motivations behind maritime exploration and trade. The rise and fall of empires, the impact of technological advancements, and the geopolitical shifts of the era are all reflected in these historical records.

This data-driven approach to visualizing maritime history offers a unique opportunity to explore the past in a new and exciting way. By understanding the intricate patterns of seafaring activity, we can better appreciate the global interconnectedness that has shaped our world.
So, embark on a virtual voyage through time and discover the maritime empires that once ruled the waves. Explore the rich history of seafaring and witness the power of data visualization to bring the past to life.

Leave a Reply